DOWNLOADS
GUIDE
March 24th, 2023 version
Understanding the Data
To identify high confidence protein-protein interactions (PPIs) in the AlphaFold (AF) output, we first identify all protein pairs that exceed a minimum, low-stringency threshold*. For pairs that pass, we then calculate several metrics that can be found in the summary table provided in the Dropbox folder. Below, we describe these metrics and how they relate to the confidence of a PPI prediction.*At least one pair of inter-chain residues has a pLDDT value > 50 and PAE value of < 15 Angstroms, and any two non-hydrogen, inter-chain atoms reside closer than 8 Angstroms (see below for pLDDT and PAE definitions).
Average number of models (avg_n_models)
Protein pairs are folded using one or more of the five AF “models” (the AF algorithm trained 5 separate times with different training sets). A key parameter is how well the different AF models predictions agree for a particular complex. This value can be fractional because in some of the models, only some of the contacts are observed. In our experience, high confidence predictions are true in >50% of the models (>1.5 out of 3 or >2.5 out of 5 models).Maximum number of models (max_n_models)
Even if not all contacts are predicted in all models, a subset of the contacts often are. The maximum number of models states how many models satisfy at least some of the contacts. In our experience, this number is maximal for high confidence PPIs: at least some contacts are true in all the models tested. The number of contacts that are true in all models can be found in the num_contacts_with_max_models column and compared to the num_unique_contacts column. The greater the fraction of contacts that are in the max model category, the better.Best model average pLDDT (best_model_avg_pLDDT)
The predicted local distance difference test (pLDDT) is an AF output that describes the confidence that an amino acid is positioned correctly relative to neighboring residues in the same chain of the prediction. It ranges from 0 (worst) to 100 (best). We calculate the average pLDDT of all the interacting residues in the best model. Confident predictions have values > 70.Best model pDOCKQ (best_model_pdockq)
pDOCKQ is a metric of prediction accuracy ranging from 0 and 1 (best) that takes into account the average pLDDT of all interacting residues and the number of interacting residues. In our experience, high confidence predictions have a value > 0.25.Best model average PAE (best_model_avg_pae)
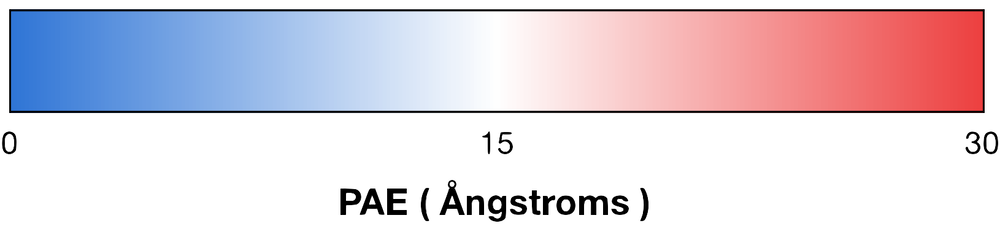
The predicted alignment error (PAE, measured in angstroms) is a global measure of residue positioning accuracy. The value is calculated for all pairs of residues within and between the two proteins being folded. The lower the value, the better (we generally look for values below 10, but there are exceptions, see below). In the PAE plots generated by AF, blue represents low PAE values and red represents high PAE values. Blue blocks within the same chain represent well-folded domains, and blue blocks between proteins represent areas where two proteins stably interact. Looking at the PAE plots of a PPI can quickly give a sense of the strength of a prediction (blue blocks in all models), and it tells you which parts of two proteins are interacting.Bottom Line
There is no single metric that is a perfect predictor of accuracy. High confidence PPIs have all good values (average models > 50%, max # models = 80-100%, pLDDT > 70, pDOCKQ > 0.25, PAE < 10). Some PPIs have values that are off the charts. For example, the DONSON homodimer, formed by an extensive interface (that was not in the AF training set), has average models 4.8/5, max models 5, pLDDT 95, pDOCKQ 0.74, PAE 1. On the other hand, DONSON’s interaction with another protein, SLD5, which we have experimentally verified via mutagenesis (also not in the training set), has average models 2.9/5, max models 5, pLDDT 72, pDOCKQ 0.25, PAE 13. In other words, some interactions that we have high confidence are true can fall short in at least one category (e.g. PAE = 13).Applying filters
If you receive data from us in the form of an interactive matrix, we recommend applying at least two filters to weed out low confidence PPIs. Click the “add filter” button and set pDOCKQ > 0.25. Click it again and apply a second filter with average # models > 50% (e.g. if three models were used, apply > 1.5, if 5 models were used, apply > 2.5).Other criteria and follow up:
For PPIs with good metrics, the next step is to look at the interaction to make sure it does not clash with known, stable PPIs made by either protein (although this does not have to be disqualifying) and whether it makes biological sense. If you see an interaction that makes a lot of sense but has poor metrics, or if you are failing to see an interaction you highly expect exists, you can try a few additional things:
- Segment the protein. Especially if one of the proteins in the pair is very large, segmenting one or both proteins into smaller pieces, or just folding the putative interacting domains can have a huge effect on AF’s ability to pick up an interaction.
- Include additional proteins. If you know that a PPI occurs in the context of other proteins, include these while folding the pair of interest. We have seen this have a significant effect on the overall confidence of a prediction. Similarly, if you suspect that one of the proteins in the pair multimerizes, fold it as a multimer. We have also seen entirely new interactions when we do this.
- Fold the pair in additional species to look for evolutionary conservation of the interaction.
- Increase the number of times the pair is cycled through the AF neural network. We don’t have great examples where this was a game changer, but have heard of instances where it worked.